lab3webmap
Lab 3: Web Map Application
Mitchell Stapelman
Introduction
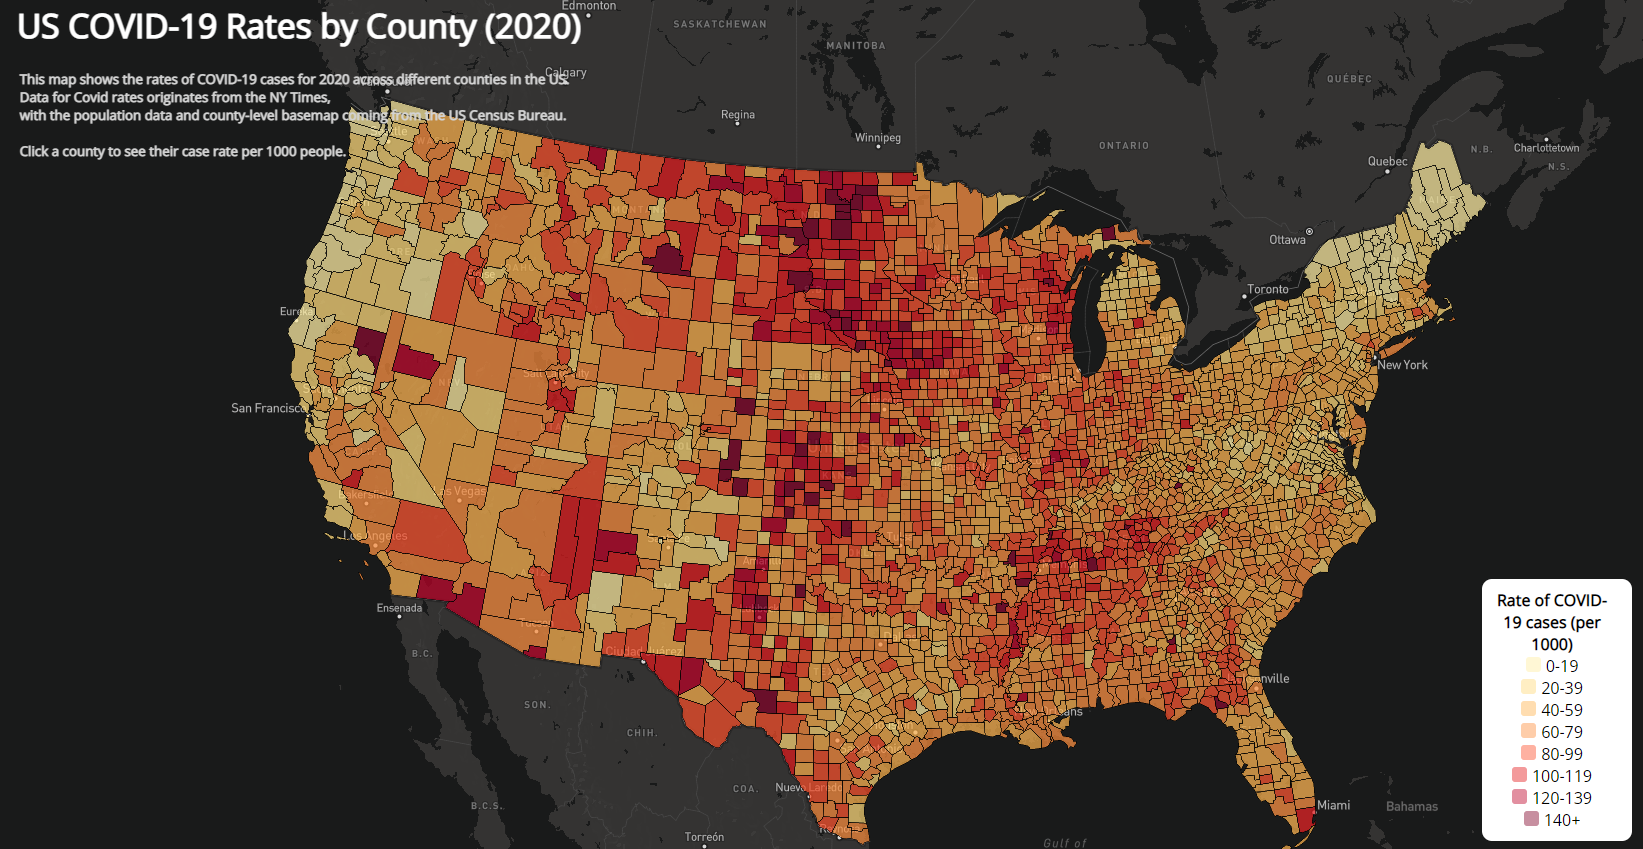
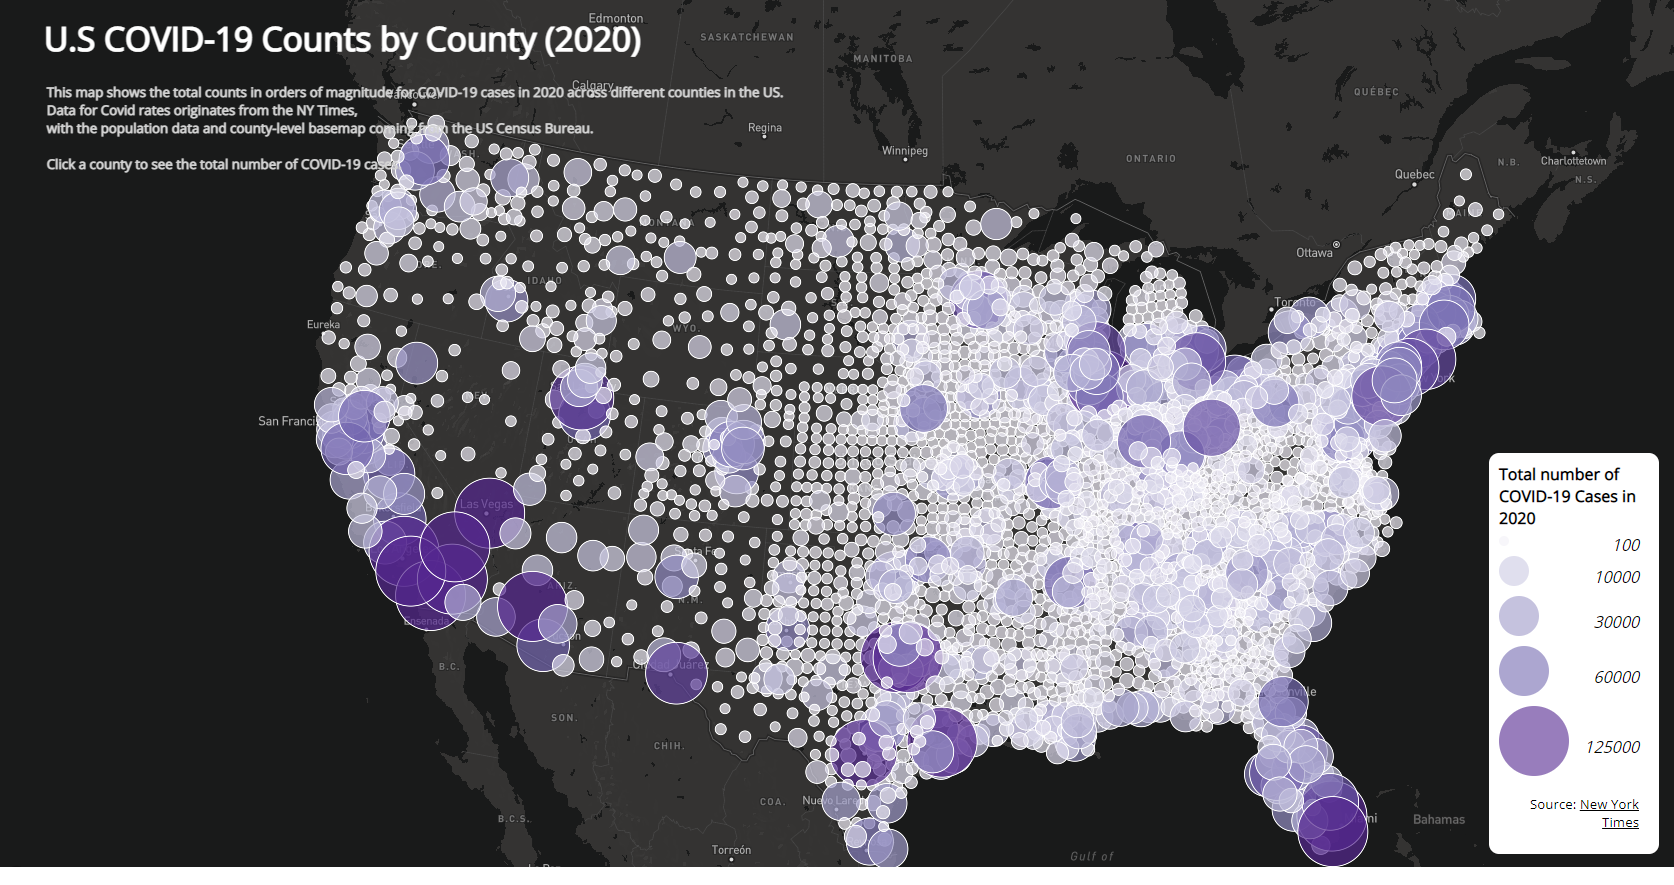
This lab introduces the Mapbox API through Javascript, where it is used to produce these two interactive maps visualizing 2020 COVID-19 rates and total count data for all counties across the US. The first choropleth map displays the case rates per 1000 people for each county, while the second is a proportional symbols map to show the total case counts. In conjunction, these maps show what regions were most affected and where the total number of COVID-19 cases were highest in the country. The data for this project comes from the New York Times, with the population data and country basemap being from the US Census Bureau. The shapefiles of this data were converted to GeoJSON in order to adapt it for mapbox.
Maps
Map 1: 2020 Choropleth Map of COVID-19 Rates
Map 2: 2020 Proportional Symbols Map of COVID-19 Rates
 https://stpme.github.io/lab3webmap/
Acknowledgements:
Data processing and lab structure made by Bo Zhao and Steven Bao.